Google Track

Saturday, December 28, 2013

Which Of The Five Types Of Data Science Does Your Startup Need?

by TOMASZ TUNGUZ

facepalm-1024x442.png
 Credit: O'Reilly

Startups, you are doing data science wrong. That’s the title of a post penned by Ryan Weald in GigaOm this week. Weald echoes DJ Patil’s idea: “product-focused data science is different than the current business intelligence style of data science.”
Weald points to a different model of data scientist, an engineer, not a statistician, who can perform queries and based upon some insights, improve the product with a few code changes and a push to git.
I like Weald’s post but disagree on one point. I don’t think there is one type of data scientist, but five.
  1. Quantitative, exploratory data scientists tend to have PhDs and use theory to understand behavior. I count Hal Varian, Chief Economist at Google, and Redpoint’s own Jamie Davidson, among them. Varian’s team researches the advertiser dynamics within the ads auction and compares those dynamics to theoretical auction models like the Vickery auction. By combining theory and exploratory research, these data scientists improve products.
  2. Operational data scientists often work in the finance, sales or operations teams at Google. In the AdSense ops team where I started, we had a star data analyst who each week would discuss our team’s performance: our email response times, the satisfaction scores of our publishers, and changes in publisher behavior by segment. His work provided a feedback loop to improve the team’s tactics and efficiency. Only infrequently were these insights used to influence product.
  3. Product data scientists tend to belong to product management or engineering. This is the group of data scientists Weald writes about. PMs and engineers sift through logs and analysis tools to understand the way users interact a product and leverage that knowledge to refine the product. At Google, the ads quality team analyzed user clicks data to improve ad targeting.
  4. Marketing data scientists segment the user base, evaluate the performance of advertising campaigns, match product features to customer segments, and design content marketing campaigns. The marketing data scientist creates awareness and leads for the sales team, helping generate revenue.
  5. Research data scientists create insights as a product. Nate Silver is arguably the most famous of them. Silver’s work doesn’t influence a product; the analysis is the product itself. Sometimes the data science leads to a thought leadership whitepaper, or a blog post, or a financial report. It’s rarer for startups to employ research scientists because the output isn’t tied to revenue. But larger companies like Google do, think tanks do, financial institutions do.
These five types of data scientists span almost every department of knowledge work. Sometime in the past thirty years, data science became inextricable from the day-to-day operation of these teams. Product, marketing, eng, sales all use data to make decisions. These teams use data to identify, understand and implement feedback loops and to reinforce the behavior a company desires.
To talk about data scientists might be too myopic. Your startup may need a research data scientist or one with a PhD. Or it may need an engineer with an understanding of basic statistics who can work up and down the Rails stack. Or another type all together.
Like any role, when hiring or recruiting a data scientist it’s important to identify what the key problems facing the business and the relevant skills the right candidate will need to solve those challenges.

Friday, December 13, 2013

Are You Recruiting A Data Scientist, Or Unicorn?

Guest blog by Jeff Bertolucci (InformationWeek)
Many companies need to stop looking for a unicorn and start building a data science team, says CEO of data applications firm Lattice.
The emergence of big data as an insight-generating (and potentially revenue-generating) engine for enterprises has many management teams asking: Do we need an in-house data scientist?
According to Shashi Upadhyay, CEO of Lattice, a big data applications provider, it doesn't make sense for organizations to hire a single data scientist, for a variety of reasons. If your budget can swing it, a data science team is the way to go. If not, data science apps may be the next best thing. "If you look at any industry, the top 10 companies can afford to have data scientists, and they should build data science teams," Upadhyay told InformationWeek in a phone interview.
But the solution is less clear for smaller organizations. "The pattern that I've seen now, having done this for over six years, is that very often medium-sized companies think of the problem as, 'I need to go and get me one data scientist,'" said Upadhyay.
[Guidelines aim to combat potential misuse of big data. Read Data Scientists Create Code Of Professional Conduct.]
But the shortage of data scientists, a problem that's only expected to worsenin the next few years, makes that approach a risky proposition.
For example, a company may hire one or two people, Upadhyay said, "but before you know it, because the supply for this talent group is so far behind demand, they have lost this person [who] has gone to the next company. And all of a sudden, all that good work is lost. And you ask yourself, 'Why did that happen? And how can I manage against it?'"
One common problem, he noted, is that companies simply don't understand data scientists and how they work. The job generally requires knowledge of a wide array of technical disciplines, including analytics, computer science, modeling, and statistics. "They also tend to be fairly conversant in business issues," Upadhyay added.
But it's often difficult to find these divergent skills in a single human being. "It's a little bit like looking for a unicorn," Upadhyay said.
When medium-sized companies -- those that fall below the top five in a given industry, for instance -- hire just one or two data scientists, they often can't provide a long-term career path for those people within the company. As a result, the data scientists get frustrated and move onto the next thing.
In Silicon Valley, where data scientists command six-figure salaries and are in great demand, it's very difficult to retain talented people.
The better solution? Build a team.
"You will absolutely get a benefit if you hire a data science team," said Upadhyay. "Go all the way [and] commit to creating a creating a career path for them. And if you do it that way, you will get the right kind of talent because people will want to work for you."
Smaller companies that can't afford data science teams should consider big data applications instead. The biggest firms -- in Upadhyay's words, "the Dells, HPs, and Microsofts of the world" -- can take both approaches: data science teams and big data apps.
The team approach seems to be winning. "I rarely see teams that are one or two people in size," Upadhyay observed. "Obviously people have those teams, but they tend to evaporate over time. Until they get to a team of 10 people or more, [companies] can't justify it."
So what does a data science team cost, and what's the payoff?
Upadhyay offered this example: Say you hire a team of 10 data scientists with an average annual cost of $150,000 per employee. "That's $1.5 million for a data science team," he said. "So they better be creating at least $15 million dollars in value for you -- 10 times [the expense] -- to be worth it."
Emerging software tools now make analytics feasible -- and cost-effective -- for most companies. Also in the Brave The Big Data Wave issue of InformationWeek: Have doubts about NoSQL consistency? Meet Kyle Kingsbury's Call Me Maybe project. (Free registration required.)

Thursday, October 31, 2013

Your Data Analysis Takes How Long?

Reference: www.biblogg.no

andycotgreave


Andy Cotgreave, Social Content Manager at Tableau Software, looks at how analytics tools can help to save valuable time

Imagine, for a moment, that you’ve been given a task to analyse a dataset inside sixty minutes and share your results. How far do you think you would get in that time?
It’s a question I had cause to reflect on recently, after running «Fanalytics», a workshop for users of Tableau Public. In the workshop, we gave people a dataset and one hour to do something cool. Their results were astounding.
To understand why they were so impressive, let me provide a little context by considering how many of us work with data.
First, let me dispel a myth. Contrary to popular opinion, if you are using spreadsheets or traditional BI tools, it is quite possible to build beautiful charts. Unfortunately, each view of your data takes considerable time to build, Do you have that time to spare in your working life? What if the chart you take 10 minutes to build doesn’t answer your question? What if it inspires a new question? You have to go back and start again.
What if you could explore your data at the speed of thought instead? What if each mouse click changed the view instantly? This is what we call visual analytics: it allows you to find insight in your data at speeds unimaginable just a few years ago.
You’re probably wondering how all of this relates to the Fanalytics competition I mentioned earlier. Well, during the session, we gave our teams a list of every UK Number one album since 1956, downloaded from Wikipedia. The instructions they were given were to analyse the data and publish something interesting within one hour.
Did they deliver? Oh, boy, yes, and in ways that made my jaw drop. Each entry was different. The winning team analysed albums that had been to number one more than once, revealing perennially popular music, and the effects of sales on a musician’s death. Another team came up with an album explorer that found out which album was number one on your birthday. One team created a visually gorgeous dashboard, sure to engage anyone. A further team came up with a predictive model based around the likelihood of any album title to get to number one. You can see all the entrants on Tableau’s Fanalytics blog post. What was truly amazing was that they did this in one hour. Sixty minutes!
Unfortunately, many people are stuck with tools that are cumbersome or too hard to use. It often takes more than an hour just to connect to data. The simple lesson I’ve learnt from the recent session is that although some tools can make amazing charts, they are often unnecessarily complicated. With some, you need to fill in five steps in a property wizard just to draw a chart. In others, you are required to write custom scripts before you can start drawing anything.
The question we need to ask is whether we are using the right tools to answer questions quickly and in the most efficient way? If not, then perhaps it’s time to ditch these time hogs and focus on analytic tools that save you time instead!

Interview with Jill Dychè on Data Management in the Era of Big Data

Guest blog: www.biblogg.no
 
Av
jill dyche


Jill Dyche, Vice President of SAS Best Practices, was keynote speaker at SAS Forum Norway in September, and was interviewed by Lars Rinnan 

Jill, you delivered a strong keynote, and the audience was really attentive.
You talked about big data and how to get the c-suite to listen. It sounds almost impossible. How do you get them to listen?

jill dyche figur2You need to meet executives where they are. In other words: figure out what’s important to them now, and then map big data as the answer.
Here’s an example: A large cable company sees an uptick in customer complaints in its call center. They have to add expensive headcount to the support staff. But they decide to incent customers to use social media interactions to ask for support or lodge complaints.  By adding social media transactions to customer profiles, the cable company can not only monitor valuable customers who may be at-risk, it can also “score” its brand reputation based on text analytics of social media interactions. They understand that over half of customer feedback comments are actually installation questions and not complaints. They develop customer support videos and post them on YouTube. Both questions and complaints are reduced, and support staff can be redeployed to cross-selling functions.

Data governance is essential, but how do you get the CXO interested?

jill dyche figur2Find the problem the CXO needs to solve, and explain how data enables the solution. Many senior executives don’t make the link between a business need and data. If you “deconstruct” the business problem into the data necessary to solve it, you can see the lights go on with executives.


How would you start a data governance process at a large company who has no clue of data governance?
Wjill dyche figur2e recommend starting with what I call a “small, controlled project.” Take a business problem, scope it down to a level where data can enable it quickly, and then implement a well-bounded process around data rules and policies necessary to address it.


How is data governance related to big data?

jill dyche figur2Big data is like any other data: It requires policy making and oversight. In that respect big data should be beholden to larger rules. For instance, data from sensors or devices that may be streaming into your company should be handled in a different way. Is it sensitive? Is it defined? Is it targeted to be consumed by a department? An individual? A machine? All of these factors, and others, should inform the policies around that data. And that’s data governance.

In your experience, are businesses giving data governance enough attention in terms of resources, technology and funding?

jill dyche figur2Only after they feel enough pain. Very few companies new to data governance actually say, “Hey! Let’s make sure we factor data governance into this new initiative.” Most have to experience the pain of not having the right data for the right business purpose. Go back to the days of Customer Relationship Management and remember how everyone thought they could just plug in a new tool? The validity of the data is directly proportional to the value of the resulting application. Data can no longer be considered an afterthought.

Thanks you for sharing these valuable insights with the readers of biblogg, Jill!

Tuesday, September 17, 2013

The Data Science Mindset

Intro 

Names like ‘R’, ‘SQL’, and ‘D3’ make data science seem more like alphabet soup than a deliberate practice of working with data. It’s so easy to get lost in the sea of acronyms, packages, and frameworks that we often find our students prematurely optimizing for the right toolset to use, unable to move forward until they have researched every available option. In reality, data science isn’t just about the tools. It’s a mindset: a way of looking at the world. It’s about taking advantage of our modern computers and all of the information that they’re already collecting to study how things work and push the limits of human knowledge just a little bit further. We have a favorite saying around here — data is everything and everything is data. If we begin with this mindset, a lot of data science approaches naturally follow.
 

Store Everything

Storage is cheap. Collect everything and ask questions later. Store it in the rawest form that is convenient, and don’t worry about how or even when you’re going to analyze it. That part comes later.

Use Existing Data

We’re already storing data — let’s use it. When faced with questions, data scientists regularly adapt the query so that it can be approximately answered with an existing and convenient dataset. The best part of data science is discovering surprising applications of existing stores of data. For example, there is a plethora of satellite imagery of Earth. We can use this data to learn about fertilizer use in Uganda, or use pictures of the Earth at night to estimate rural electrification in developing countries.

Connect Datasets

We’re storing everything, all over the world, inexpensively, for the first time in history. There are many lessons to be learned by utilizing more of this treasure trove. Don’t worry about making the best use out of a single source of data. Focus on connecting disparate datasets rather than tuning your models. Conventional statistics teaches a lot about how to choose analysis methods that are appropriate for your data collection approach and how to tune the models for a specific dataset.
Effective data science is about using a range of datasets, connecting the dots between one set of data and another, such as predicting restaurant health scores based on Yelp reviews. In machine learning speak: it’s often better to collect more features rather than spend days optimizing hyperparameters.

Anything Can Be Quantified

Our culture loves to quantify. If you can turn it into a number, that number can be put into a table. Importantly, that table can now be processed by a computer.
A spreadsheet about sewer overflows is clearly data to most people, but what about a calendar? At first, a calendar might not seem like the sort of data that you analyze with statistics. However, you can also represent a calendar as a spreadsheet and as a graph.


Data science becomes a creative endeavor when peeling away the obvious variables presented to you. Maybe you have a bunch of PDF documents. You could easily extract the text in the PDFs and search through the content. Depending on the problem you are solving, these files hold more interesting information than just the text. You can get the page count, the file size, and the shapes of the pages and the program that created it. There is information hidden in many datasets that goes beyond what’s immediately obvious.
There is a lot of talk about the difference between different kinds of data. There’s “qualitative” vs. “quantitative” and “unstructured” vs. “structured.” To me, there isn’t much difference between “qualitative” and “quantitative” data, nor is there between “unstructured” and “structured” data because I know that I can convert between the different types.
At first, the registration papers of company might not seem like interesting data. They begin as paper, most of the fields are text, and the formats aren’t particularly standardized. But when you put them in a database in a machine-readable format, qualitative data becomes quantitative data that can be used to supplement other data sources.

Send Boring Work to Robots

We no longer live in an era where “computer” refers to someone who carries out calculations. Find yourself doing something over and over? Give it to the bots. As far as data analysis goes, modern computers can be far more effective at rote tasks, such as drawing new graphs with every update of a dataset.
Data collection is a prime example of a task that should be automated. A common scene in university research labs is swaths of grad students handing out paper questionnaires to participants of studies. The data scientist says: collect the data automatically and unobtrusively, using existing systems whenever possible. The supercomputers we carry in our pocket are a great place to start.
This mindset can be applied not only to the data, but also to the process itself. Rather than learning and remembering your entire analysis process, you can write a program that does the whole thing for you, from the original acquisition of the data, to the modeling, to the presentation of results to another person. By making everything a program, you make it easier to find mistakes, to update your analyses, and reproduce your results.

Tools

Once inside the data science mindset, solving interesting problems becomes a function of data acquisition and processing. Computers can fit models and make predictions about datasets that are too big to wrap your head around and convert paper documents into electronic tables. They probably know more about you and your habits than you know yourself! Use the tools available to you, but don’t get caught up on the tools themselves.
Properly discussing these relevant tools is another post (maybe a book), but here’s one thought. While it always helps to have more education, you don’t need a PhD in math or computer science in order to create useful things. Loads of wonderful algorithms have already been implemented for you, and simple algorithms often work quite well. If you’re just getting started, focus on the “plumbing” that connects different datasets and systems together.

Data Science Mindset at Zipfian Academy

Our course teaches many data science tools, but we also teach the data science mindset, because you need both to be a great data scientist. To this end, we organize our 12-week course by projects — such as a recommendation engine or spam filter — rather than software packages or algorithms. We teach the various tools in context of applied projects so students learn how to choose the appropriate tool and how to build the plumbing that connects them.
In the end, it’s not about the newest, trendiest framework or fastest data analysis platform. It’s about finding interesting insights from your data and sharing it with the world. Start small, get your hands dirty, and have fun!

Wednesday, July 17, 2013

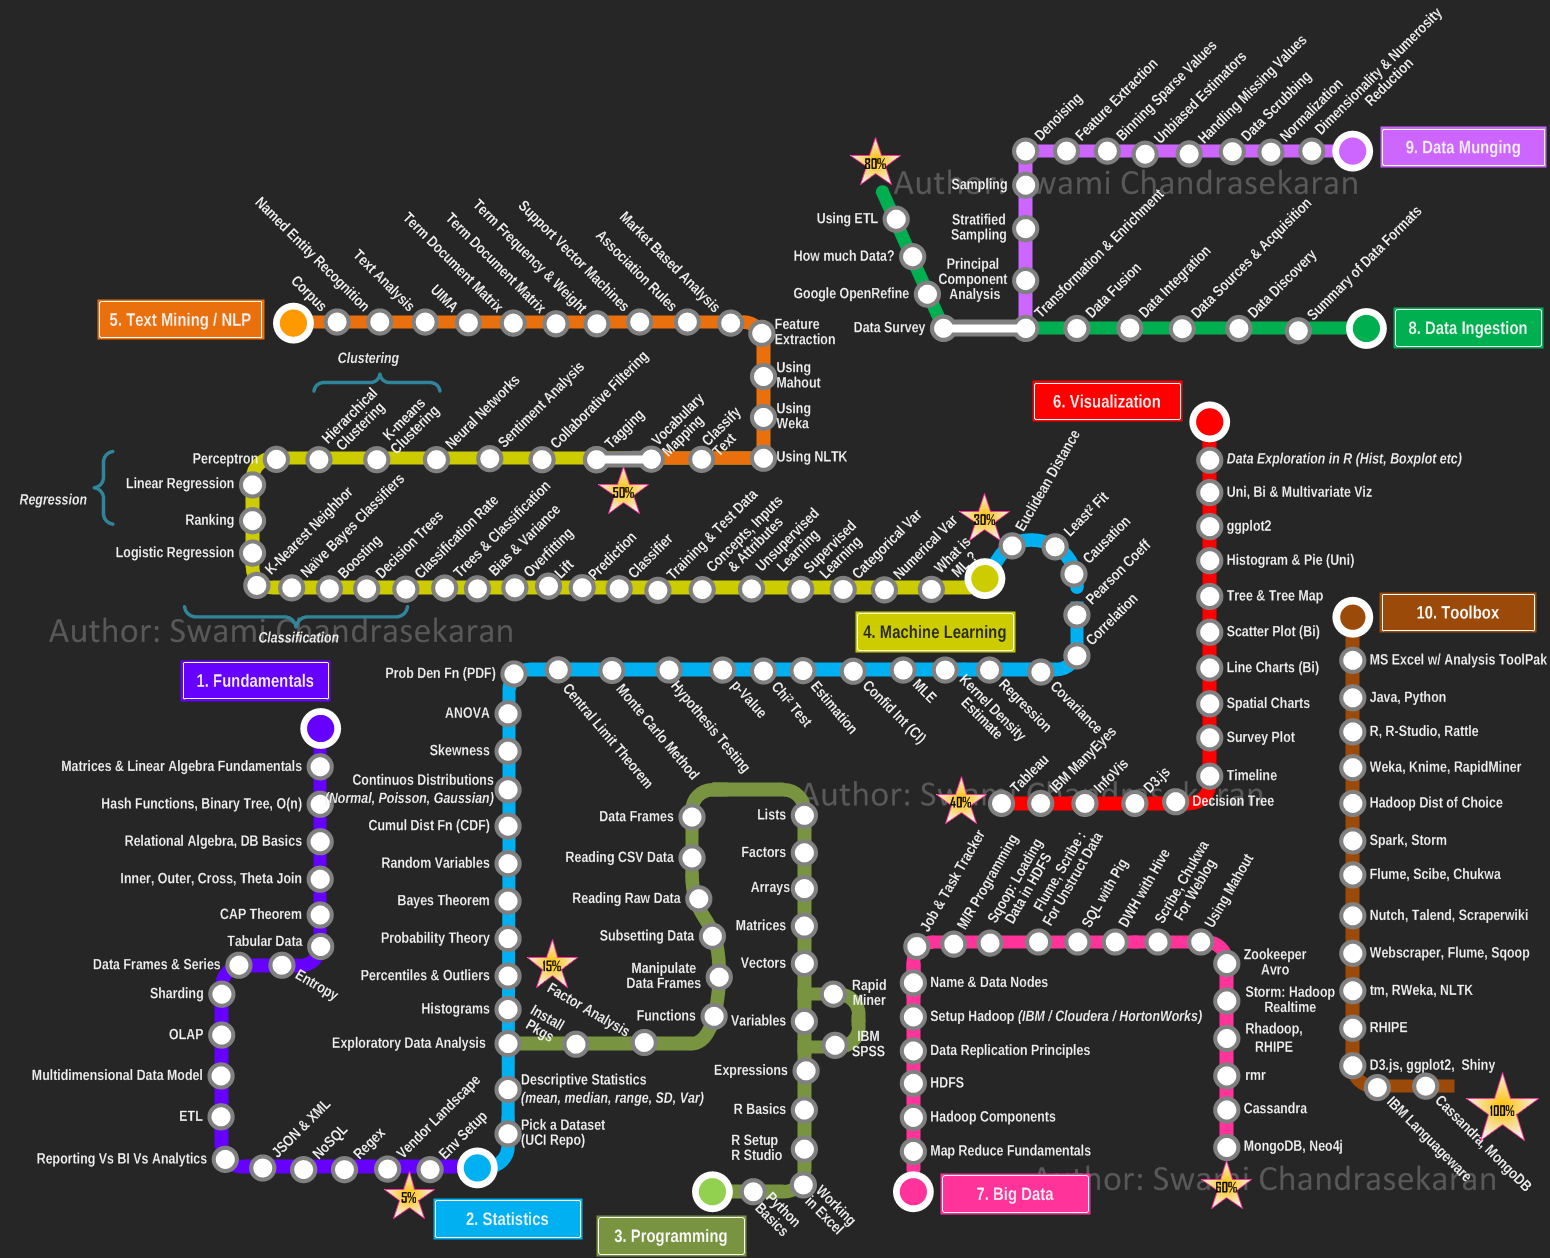
Becoming a Data Scientist – Curriculum via Metromap

by Swami Chandrasekaran

Data Science, Machine Learning, Big Data Analytics, Cognitive Computing .... well all of us have been avalanched with articles, skills demand info graph's and point of views on these topics (yawn!). One thing is for sure; you cannot become a data scientist overnight. Its a journey, for sure a challenging one. But how do you go about becoming one? Where to start? When do you start seeing light at the end of the tunnel? What is the learning roadmap? What tools and techniques do I need to know? How will you know when you have achieved your goal?
Given how critical visualization is for data science, ironically I was not able to find (except for a few), pragmatic and yet visual representation of what it takes to become a data scientist. So here is my modest attempt at creating a curriculum, a learning plan that one can use in this becoming a data scientist journey. I took inspiration from the metro maps and used it to depict the learning path. I organized the overall plan progressively into the following areas / domains,
  1. Fundamentals
  2. Statistics
  3. Programming
  4. Machine Learning
  5. Text Mining / Natural Language Processing
  6. Data Visualization
  7. Big Data
  8. Data Ingestion
  9. Data Munging
  10. Toolbox
Each area  / domain is represented as a "metro line", with the stations depicting the topics you must learn / master / understand in a progressive fashion. The idea is you pick a line, catch a train and go thru all the stations (topics) till you reach the final destination (or) switch to the next line. I have progressively marked each station (line) 1 thru 10 to indicate the order in which you travel. You can use this as an individual learning plan to identify the areas you most want to develop and the acquire skills. By no means this is the end; but a solid start. Feel free to leave your comments and constructive feedback.
PS: I did not want to impose the use of any commercial tools in this plan. I have based this plan on tools/libraries available as open source for the most part. If you have access to a commercial software such as IBM SPSS or SAS Enterprise Miner, by all means go for it. The plan still holds good.
PS: I originally wanted to create an interactive visualization using D3.js or InfoVis. But wanted to get this out quickly. Maybe I will do an interactive map in the next iteration.


Wednesday, May 29, 2013

THE NORWEGIAN BI BAROMETER


The Norwegian BI barometer: A survey of BI maturity in the Norwegian market
Are Norwegian companies best in class when it comes to using information for management purposes? Or are they laggards compared to other countries, relying on gut feeling and experience? For the first time there will be a large scale survey of BI maturity in Norway. The survey will give an indication of the level of maturity in using BI in Norwegian companies. The survey will point out which areas are more mature, and which require more attention, both in total and divided by industry and company size. Is your company more or less mature than the industry average? Which areas are most and least mature? Get useful pointers for your own BI efforts at this presentation.