Google Track

Showing posts with label statistics. Show all posts

Saturday, December 28, 2013

Which Of The Five Types Of Data Science Does Your Startup Need?

by TOMASZ TUNGUZ

facepalm-1024x442.png
 Credit: O'Reilly

Startups, you are doing data science wrong. That’s the title of a post penned by Ryan Weald in GigaOm this week. Weald echoes DJ Patil’s idea: “product-focused data science is different than the current business intelligence style of data science.”
Weald points to a different model of data scientist, an engineer, not a statistician, who can perform queries and based upon some insights, improve the product with a few code changes and a push to git.
I like Weald’s post but disagree on one point. I don’t think there is one type of data scientist, but five.
  1. Quantitative, exploratory data scientists tend to have PhDs and use theory to understand behavior. I count Hal Varian, Chief Economist at Google, and Redpoint’s own Jamie Davidson, among them. Varian’s team researches the advertiser dynamics within the ads auction and compares those dynamics to theoretical auction models like the Vickery auction. By combining theory and exploratory research, these data scientists improve products.
  2. Operational data scientists often work in the finance, sales or operations teams at Google. In the AdSense ops team where I started, we had a star data analyst who each week would discuss our team’s performance: our email response times, the satisfaction scores of our publishers, and changes in publisher behavior by segment. His work provided a feedback loop to improve the team’s tactics and efficiency. Only infrequently were these insights used to influence product.
  3. Product data scientists tend to belong to product management or engineering. This is the group of data scientists Weald writes about. PMs and engineers sift through logs and analysis tools to understand the way users interact a product and leverage that knowledge to refine the product. At Google, the ads quality team analyzed user clicks data to improve ad targeting.
  4. Marketing data scientists segment the user base, evaluate the performance of advertising campaigns, match product features to customer segments, and design content marketing campaigns. The marketing data scientist creates awareness and leads for the sales team, helping generate revenue.
  5. Research data scientists create insights as a product. Nate Silver is arguably the most famous of them. Silver’s work doesn’t influence a product; the analysis is the product itself. Sometimes the data science leads to a thought leadership whitepaper, or a blog post, or a financial report. It’s rarer for startups to employ research scientists because the output isn’t tied to revenue. But larger companies like Google do, think tanks do, financial institutions do.
These five types of data scientists span almost every department of knowledge work. Sometime in the past thirty years, data science became inextricable from the day-to-day operation of these teams. Product, marketing, eng, sales all use data to make decisions. These teams use data to identify, understand and implement feedback loops and to reinforce the behavior a company desires.
To talk about data scientists might be too myopic. Your startup may need a research data scientist or one with a PhD. Or it may need an engineer with an understanding of basic statistics who can work up and down the Rails stack. Or another type all together.
Like any role, when hiring or recruiting a data scientist it’s important to identify what the key problems facing the business and the relevant skills the right candidate will need to solve those challenges.

Tuesday, September 17, 2013

The Data Science Mindset

Intro 

Names like ‘R’, ‘SQL’, and ‘D3’ make data science seem more like alphabet soup than a deliberate practice of working with data. It’s so easy to get lost in the sea of acronyms, packages, and frameworks that we often find our students prematurely optimizing for the right toolset to use, unable to move forward until they have researched every available option. In reality, data science isn’t just about the tools. It’s a mindset: a way of looking at the world. It’s about taking advantage of our modern computers and all of the information that they’re already collecting to study how things work and push the limits of human knowledge just a little bit further. We have a favorite saying around here — data is everything and everything is data. If we begin with this mindset, a lot of data science approaches naturally follow.
 

Store Everything

Storage is cheap. Collect everything and ask questions later. Store it in the rawest form that is convenient, and don’t worry about how or even when you’re going to analyze it. That part comes later.

Use Existing Data

We’re already storing data — let’s use it. When faced with questions, data scientists regularly adapt the query so that it can be approximately answered with an existing and convenient dataset. The best part of data science is discovering surprising applications of existing stores of data. For example, there is a plethora of satellite imagery of Earth. We can use this data to learn about fertilizer use in Uganda, or use pictures of the Earth at night to estimate rural electrification in developing countries.

Connect Datasets

We’re storing everything, all over the world, inexpensively, for the first time in history. There are many lessons to be learned by utilizing more of this treasure trove. Don’t worry about making the best use out of a single source of data. Focus on connecting disparate datasets rather than tuning your models. Conventional statistics teaches a lot about how to choose analysis methods that are appropriate for your data collection approach and how to tune the models for a specific dataset.
Effective data science is about using a range of datasets, connecting the dots between one set of data and another, such as predicting restaurant health scores based on Yelp reviews. In machine learning speak: it’s often better to collect more features rather than spend days optimizing hyperparameters.

Anything Can Be Quantified

Our culture loves to quantify. If you can turn it into a number, that number can be put into a table. Importantly, that table can now be processed by a computer.
A spreadsheet about sewer overflows is clearly data to most people, but what about a calendar? At first, a calendar might not seem like the sort of data that you analyze with statistics. However, you can also represent a calendar as a spreadsheet and as a graph.


Data science becomes a creative endeavor when peeling away the obvious variables presented to you. Maybe you have a bunch of PDF documents. You could easily extract the text in the PDFs and search through the content. Depending on the problem you are solving, these files hold more interesting information than just the text. You can get the page count, the file size, and the shapes of the pages and the program that created it. There is information hidden in many datasets that goes beyond what’s immediately obvious.
There is a lot of talk about the difference between different kinds of data. There’s “qualitative” vs. “quantitative” and “unstructured” vs. “structured.” To me, there isn’t much difference between “qualitative” and “quantitative” data, nor is there between “unstructured” and “structured” data because I know that I can convert between the different types.
At first, the registration papers of company might not seem like interesting data. They begin as paper, most of the fields are text, and the formats aren’t particularly standardized. But when you put them in a database in a machine-readable format, qualitative data becomes quantitative data that can be used to supplement other data sources.

Send Boring Work to Robots

We no longer live in an era where “computer” refers to someone who carries out calculations. Find yourself doing something over and over? Give it to the bots. As far as data analysis goes, modern computers can be far more effective at rote tasks, such as drawing new graphs with every update of a dataset.
Data collection is a prime example of a task that should be automated. A common scene in university research labs is swaths of grad students handing out paper questionnaires to participants of studies. The data scientist says: collect the data automatically and unobtrusively, using existing systems whenever possible. The supercomputers we carry in our pocket are a great place to start.
This mindset can be applied not only to the data, but also to the process itself. Rather than learning and remembering your entire analysis process, you can write a program that does the whole thing for you, from the original acquisition of the data, to the modeling, to the presentation of results to another person. By making everything a program, you make it easier to find mistakes, to update your analyses, and reproduce your results.

Tools

Once inside the data science mindset, solving interesting problems becomes a function of data acquisition and processing. Computers can fit models and make predictions about datasets that are too big to wrap your head around and convert paper documents into electronic tables. They probably know more about you and your habits than you know yourself! Use the tools available to you, but don’t get caught up on the tools themselves.
Properly discussing these relevant tools is another post (maybe a book), but here’s one thought. While it always helps to have more education, you don’t need a PhD in math or computer science in order to create useful things. Loads of wonderful algorithms have already been implemented for you, and simple algorithms often work quite well. If you’re just getting started, focus on the “plumbing” that connects different datasets and systems together.

Data Science Mindset at Zipfian Academy

Our course teaches many data science tools, but we also teach the data science mindset, because you need both to be a great data scientist. To this end, we organize our 12-week course by projects — such as a recommendation engine or spam filter — rather than software packages or algorithms. We teach the various tools in context of applied projects so students learn how to choose the appropriate tool and how to build the plumbing that connects them.
In the end, it’s not about the newest, trendiest framework or fastest data analysis platform. It’s about finding interesting insights from your data and sharing it with the world. Start small, get your hands dirty, and have fun!

Wednesday, July 17, 2013

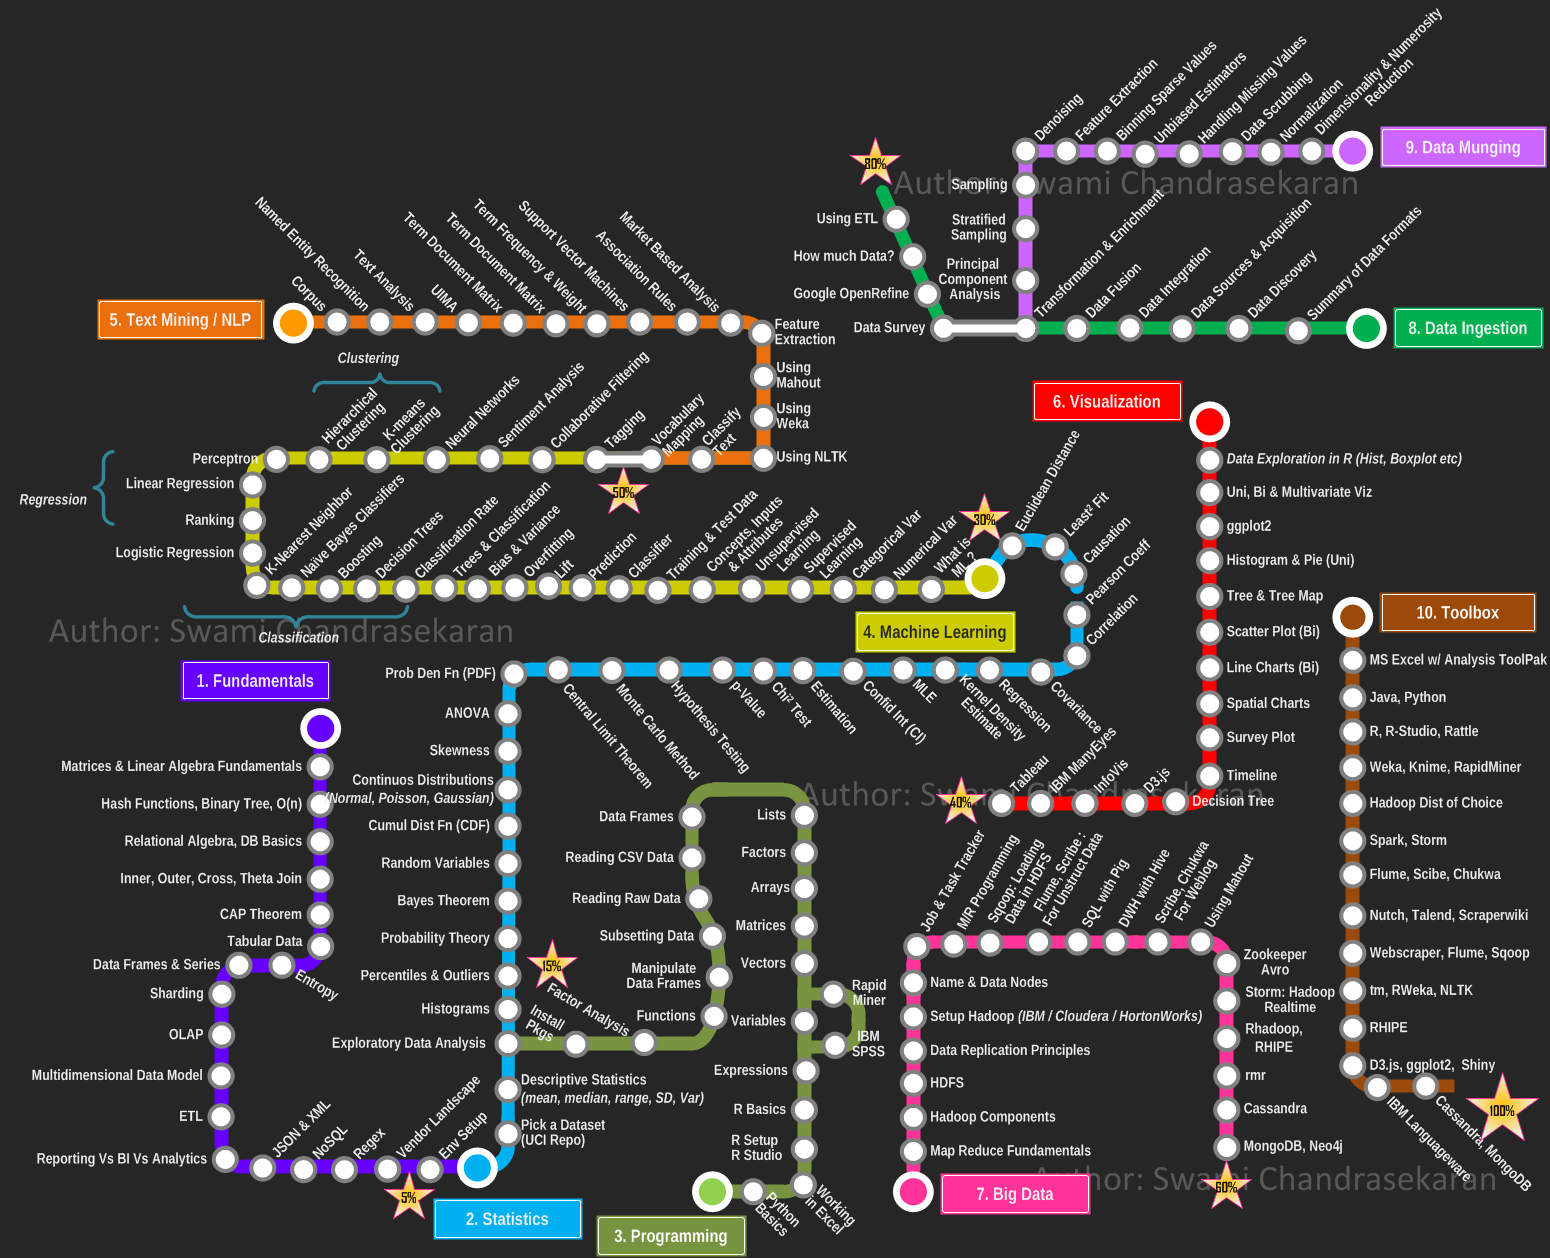
Becoming a Data Scientist – Curriculum via Metromap

by Swami Chandrasekaran

Data Science, Machine Learning, Big Data Analytics, Cognitive Computing .... well all of us have been avalanched with articles, skills demand info graph's and point of views on these topics (yawn!). One thing is for sure; you cannot become a data scientist overnight. Its a journey, for sure a challenging one. But how do you go about becoming one? Where to start? When do you start seeing light at the end of the tunnel? What is the learning roadmap? What tools and techniques do I need to know? How will you know when you have achieved your goal?
Given how critical visualization is for data science, ironically I was not able to find (except for a few), pragmatic and yet visual representation of what it takes to become a data scientist. So here is my modest attempt at creating a curriculum, a learning plan that one can use in this becoming a data scientist journey. I took inspiration from the metro maps and used it to depict the learning path. I organized the overall plan progressively into the following areas / domains,
  1. Fundamentals
  2. Statistics
  3. Programming
  4. Machine Learning
  5. Text Mining / Natural Language Processing
  6. Data Visualization
  7. Big Data
  8. Data Ingestion
  9. Data Munging
  10. Toolbox
Each area  / domain is represented as a "metro line", with the stations depicting the topics you must learn / master / understand in a progressive fashion. The idea is you pick a line, catch a train and go thru all the stations (topics) till you reach the final destination (or) switch to the next line. I have progressively marked each station (line) 1 thru 10 to indicate the order in which you travel. You can use this as an individual learning plan to identify the areas you most want to develop and the acquire skills. By no means this is the end; but a solid start. Feel free to leave your comments and constructive feedback.
PS: I did not want to impose the use of any commercial tools in this plan. I have based this plan on tools/libraries available as open source for the most part. If you have access to a commercial software such as IBM SPSS or SAS Enterprise Miner, by all means go for it. The plan still holds good.
PS: I originally wanted to create an interactive visualization using D3.js or InfoVis. But wanted to get this out quickly. Maybe I will do an interactive map in the next iteration.


Sunday, April 14, 2013

My life in Norway: Pursuing the dream (part I)

Before I start telling my dream story, it would be better to say who am I in few lines:


Born and raised in Macedonia, spent 4-5 years in Kosova and then migrated first time in Norway. My family was one of the few interested in science, specially in math, where my father was a math professor and most of my uncles studied math or engineering. I inherited the love to science and math, continued developing my self focused in math by becoming one the best in local, national and international competition of both math and physics (kind of applied mathematics).
Studied computer technology at University of Prishtina and 3 year in row won the University scholarship.
Studied with International professors from Concordia University; Vienna Institute of Technology and Institute Jean Lui Vives.

Even physically in Kosova, my dream was just to move to a more prospered countries to pursue my dream of being a great scientist. I have heard of UK, US and the big american dream, but never thought of Norway....

I moved in Norway some years ago and then I come back May 2010, pursuing my dream for a better career. I never thought that this will the time when the Revolution of my life started. I will never forget the time when I was sitting home and got a call that was actually a job opportunity to work in Norway, to work for one the best companies in the World, Nordic Choice Hotels. I answered with BIG YES and came to the first interview. It was all by the plan, the first interview was successful. Waited in Oslo for a couple of days, where I got invitation for the second round which was decisive. One day after that, I got the call of my career, saying the your job opportunity is now a job offer. Without hesitating I said YES and that was the biggest "yes" of my life, because what happened after proved this conclusion. Still not understanding in what wonderful world I was stepping in.

After signing the contract and some official paper work I started to work in June/July. I was thrilling to start with my new company and bring the successful project of Business Intelligence into live.I had time read and understand the business concept and strategy of Nordic Choice Hotels, so I was ready to dive in directly to the solution.

One of the biggest highlights of my career here is meeting the owner of Nordic Choice Hotels and bunch of other business around Norway, Mr. Petter A. Stordalen. His ability to give energy at any time in the company was special. You could feel his absence or his presence without seeing him at all.


Me and Petter Stordalen at Garden Party

During the time being at Choice, I had the opportunity to meet other important people as well, so I learned a lot from them.

Me and my department made great efforts on creating the best BI solution for the company in a given condition and situation. So we excelled by creating this solution presented in the video:


But things came to an end, sometimes without our willing, so in April I had to change my job and pursue my professional dream at Nextbridge AS. 

Why Nextbridge AS?

NextBridge is an IT-consultancy dedicated solely to business intelligence (BI). The company encompasses more than 100 years of collective experience in this field. Our services span most areas of the BI field; from DWH to reporting, from scorecards and dashboards to data mining and statistical analysis, from BI Competency Centers to maturity analysis. 
NextBridge assists the largest and most demanding clients in improving their managerial information. Our client segment is Norwegian Top 500 accounts and include Sparebank1, SG Finans, Gjensidige, BNBank, Helse Nord and NorgesEnergi . NextBridge consultants are bilingual, and speak both business and IT. Our mission is ”Bridging business and IT at the next level”. Our vision is to be the reference in the field of BI.

The blog post is public, I would not share too much of the details, so I will just jump to give a introduction of my professional profile:

""
I am an IT professional with focus on Business and Data Analytic, prefer to call myself Data Scientist. I have in depth experience using and implementing business intelligence/data analysis tools with greatest strength in the Microsoft SQL Server / Business Intelligence Studio SSIS, SSAS, SSRS. I have designed, developed, tested, debugged, and documented Analysis and Reporting processes for enterprise wide data warehouse implementations using the SQL Server / BI Suite. I also have designed/modeled OLAP cubes using SSAS and developed them using MS SQL BIDS SSAS and MDX. Served as an implementation team member where I translated source mapping documents and reporting requirements into dimensional data models. Strong ability to work closely with business and technical teams to understand, document, design and code SSAS, MDX, DMX, DAX abd ETL processes, along with the ability to effectively interact with all levels of an organization. Additional BI tool experience includes ProClarity, Microsoft Performance Point, MS Office Excel and MS SharePoint.
""

Professional highlights:

1. Worked for Capgemini Norway AS

2. Worked for Nordic Choice Hotels AS

3. Working for Nextbridge AS


Academic Honors:

MIT Honor Code Certificate: CS and Programming (04.06.2013)

Princeton University Honor Code Certificate:  Analytic Combinatorics (10.07.2013)

Stanford University Honor Code Certificate: Mathematical Thinking,, Cryptography (06.05.2013)

IIT University Honor Code Certificate: Web Intelligence and Big Data (02.06.2013)

Wesleyan University: Passion Driven Statistics (20.05.2013)


Career Highlights:

1. Over Nine years of experience in the field of Information Technology, System Analysis and Design, Data
    warehousing, Business Intelligence and Data Science in general

2. Experienced in implementing / managing large scale complex projects involving multiple stakeholders and
    leading and directing multiple project teams

3. Track record of delivering customer focused, well planned, quality products on time, while adapting to
    shifting and conflicting demands and priorities.

4. Experience in Data warehouse / Business Intelligence developments, implementation and operation setup

5. Expertise in Data Modeling, Data Analytics and Predictive Analytics SSAS, MDX and DMX

6. Strong Knowledge in Data warehouse, Data Extraction, Transformation, and Loading ETL

7. Excellent track record in developing and maintaining enterprise wide web based report systems and portals in Finance, Enterprise wide solutions and BI and Strategy Systems

8. Best new employee for 2011 of Nordic Choice Hotels AS


Achievments:

1. First place in reagional math competitions in 2 years in a row

2. First place in Physics competition in a Balkaniada (Balkan Olympics in Theoretical Physics)

3. First place in fast math competition in International Kangourou Competition

4. First place in Norway in Microsoft Virtual Academy (Microsoft Business Intelligence)

Research Work:

1. Riccati Differential Equation solution (published in printed version Research Journal)


3. Personal Finance Intelligence; published in IJSER 8 August 2012 edition


Next you will read: Life in Norway: Living the dream (part II), STAY TUNED!

Friday, March 9, 2012

How I do Predictive Analytics without Data Mining?

This hot topic is comming soon. I will just describe a bit what will this topic will include. This topic is going to show how to do Predictive Analytics on your data without using Data Mining or DMX and just using MDX. How can Data Mining prediction Algorithms be "translated" from DMX to MDX. How accurate are they and what is the benefit of using MDX?

Tuesday, November 9, 2010

Information Managment Concepts

Following the behavioral science theory of management, mainly developed at Carnegie Mellon University and prominently represented by Barnard, Richard M. Cyert, March and Simon, most of what goes on in service organizations is actually decision making and information processes. The crucial factor in the information and decision process analysis is thus individuals’ limited ability to process information and to make decisions under these limitations.

According to March and Simon [1], organizations have to be considered as cooperative systems with a high level of information processing and a vast need for decision making at various levels. They also claimed that there are factors that would prevent individuals from acting strictly rational, in opposite to what has been proposed and advocated by classic theorists

Instead of using the model of the economic man, as advocated in classic theory, they proposed the administrative man as an alternative based on their argumentation about the cognitive limits of rationality.

While the theories developed at Carnegie Mellon clearly filled some theoretical gaps in the discipline, March and Simon [1] did not propose a certain organizational form that they considered especially feasible for coping with cognitive limitations and bounded rationality of decision-makers. Through their own argumentation against normative decision-making models, i.e., models that prescribe people how they ought to choose, they also abandoned the idea of an ideal organizational form.

In addition to the factors mentioned by March and Simon, there are two other considerable aspects, stemming from environmental and organizational dynamics. Firstly, it is not possible to access, collect and evaluate all environmental information being relevant for taking a certain decision at a reasonable price, i.e., time and effort [2]. In other words, following a national economic framework, the transaction cost associated with the information process is too high. Secondly, established organizational rules and procedures can prevent the taking of the most appropriate decision, i.e., that a sub-optimum solution is chosen in accordance to organizational rank structure or institutional rules, guidelines and procedures [3] [4], an issue that also has been brought forward as a major critique against the principles of bureaucratic organizations.[5]

According to the Carnegie Mellon School and its followers, information management, i.e., the organization's ability to process information, is at the core of organizational and managerial competencies. Consequently, strategies for organization design must be aiming at improved information processing capability. Jay Galbraith [6] has identified five main organization design strategies within two categories — increased information processing capacity and reduced need for information processing.

1.Reduction of information processing needs
1.Environmental management
2.Creation of slack resources
3.Creation of self-contained tasks
2.Increasing the organizational information processing capacity
1.Creation of lateral relations
2.Vertical information systems
Environmental management. Instead of adapting to changing environmental circumstances, the organization can seek to modify its environment. Vertical and horizontal collaboration, i.e. cooperation or integration with other organizations in the industry value system are typical means of reducing uncertainty. An example of reducing uncertainty in relation to the prior or demanding stage of the industry system is the concept of Supplier-Retailer collaboration or Efficient Customer Response.

Creation of slack resources. In order to reduce exceptions, performance levels can be reduced, thus decreasing the information load on the hierarchy. These additional slack resources, required to reduce information processing in the hierarchy, represent an additional cost to the organization. The choice of this method clearly depends on the alternative costs of other strategies.

Creation of self-contained tasks. Achieving a conceptual closure of tasks is another way of reducing information processing. In this case, the task-performing unit has all the resources required to perform the task. This approach is concerned with task (de-)composition and interaction between different organizational units, i.e. organizational and information interfaces.

Creation of lateral relations. In this case, lateral decision processes are established that cut across functional organizational units. The aim is to apply a system of decision subsidiarity, i.e. to move decision power to the process, instead of moving information from the process into the hierarchy for decision-making.

Investment in vertical information systems. Instead of processing information through the existing hierarchical channels, the organization can establish vertical information systems. In this case, the information flow for a specific task (or set of tasks) is routed in accordance to the applied business logic, rather than the hierarchical organization.

Following the lateral relations concept, it also becomes possible to employ an organizational form that is different from the simple hierarchical information. The Matrix organization is aiming at bringing together the functional and product departmental bases and achieving a balance in information processing and decision making between the vertical (hierarchical) and the horizontal (product or project) structure. The creation of a matrix organization can also be considered as management's response to a persistent or permanent demand for adaptation to environmental dynamics, instead of the response to episodic demands.

Source: Wikipedia

Saturday, June 19, 2010

Analyzing data

As you can imagine, the amount of data contained in a modern business is
enormous. If the data were very small, you could simply use Microsoft Excel
and perform all of the ad-hoc analysis you need with a Pivot Table. However,
when the rows of data reach into the billions, Excel is not capable of handling
the analysis on its own. For these massive databases, a concept called OnLine
Analytical Process (OLAP) is required. Microsoft’s implementation of OLAP is
called SQL Server Analysis Services (SSAS), which I cover in detail in Chapter 8.
If you’ve used Excel Pivot Tables before, think of OLAP as essentially a massive
Pivot Table with hundreds of possible pivot points and billions of rows
of data. A Pivot Table allows you to re-order and sum your data based on different
criteria. For example, you may want to see your sales broken down by
region, product, and sales rep one minute and then quickly re-order the groupings
to include product category, state, and store.
In Excel 2010 there is a new featured called PowerPivot that brings OLAP to
your desktop. PowerPivot allows you to pull in millions of rows of data and
work with it just like you would a smaller set of data. After you get your Excel
sheet how you want it, you can upload it to a SharePoint 2010 site and share
it with the rest of your organization.
With PowerPivot you are building your own Cubes right on your desktop using
Excel. If you use PowerPivot, you can brag to your friends and family that you
are an OLAP developer. Just don’t tell them you are simply using Excel and
Microsoft did some magic under the covers.
When you need a predefined and structured Cube that is already built for
you, then you turn to your IT department.