Google Track

Showing posts with label mining. Show all posts

Sunday, March 23, 2014

MH370 flight mystery may have an answer


Data Science perspective: MH370 flight data are crucial

It has been a while and still no answer for the missing airplane of flight MH370. This case may give many possibilities, so guessing by trying each of them is painful and may lead to wrong directions, time consuming and frustrations. So simulating both physical and mathematical model maybe an answer

Mathematical Model

Data Science is newly established profession to solve problems with data insights in high volume of data, so in this case like airplane information systems, weather condition, pattern recognition, path selections etc.
Based in the data above, Data Scientists like me can build specific models to adapt exact or similar scenarios of the missing plane in the line MH370
This may give as good picture what may happen to flight, where may landed, what weather condition we had on that time, what other circumstances occurred and what impact they had over the plane.


Picture: Possible routes

If Malaysian Airport can provide with specific technical information about MH370 airplane, historical data of all MH370 flights, we may find important patterns to solve this mystery. Period between departure and lost signal may give us the distance compared to average distance of all MH370 flights on the same period. Adding weather condition may help us to segments the other MH370 flights that had same weather condition to seek specific scenarios under same weather condition. Route lines are similar to all flights in the same airline, but segmenting them to specific conditions of the missing flight like weather, airplane type, technical conditions, air pressure etc… may lead us to better targets. Technical check before departure may give us information of what have been checked or not and if there is room for possible technical failure. If there is room for failures, we can use data from all technical failure plan crashes to predict the time occurred the failure by that distance also segmented to adapt most the missing flight model.
Big Data technology provides us with the power to analyze big and complicated data sets, and there are plenty of professionals to do so.

Physical model- Simulation

I am not the expert of the field but it can be very smart to build a flight simulation of MH370 based on the mathematical model that we provided here and including other external data that have impact on the fight itself. Sometimes visualization may bring in table other factors that may be decisive in solving the mystery.
These represent alternative approaches to what may help involved institutions to solve this case and I hope they may consider these.

Wednesday, July 17, 2013

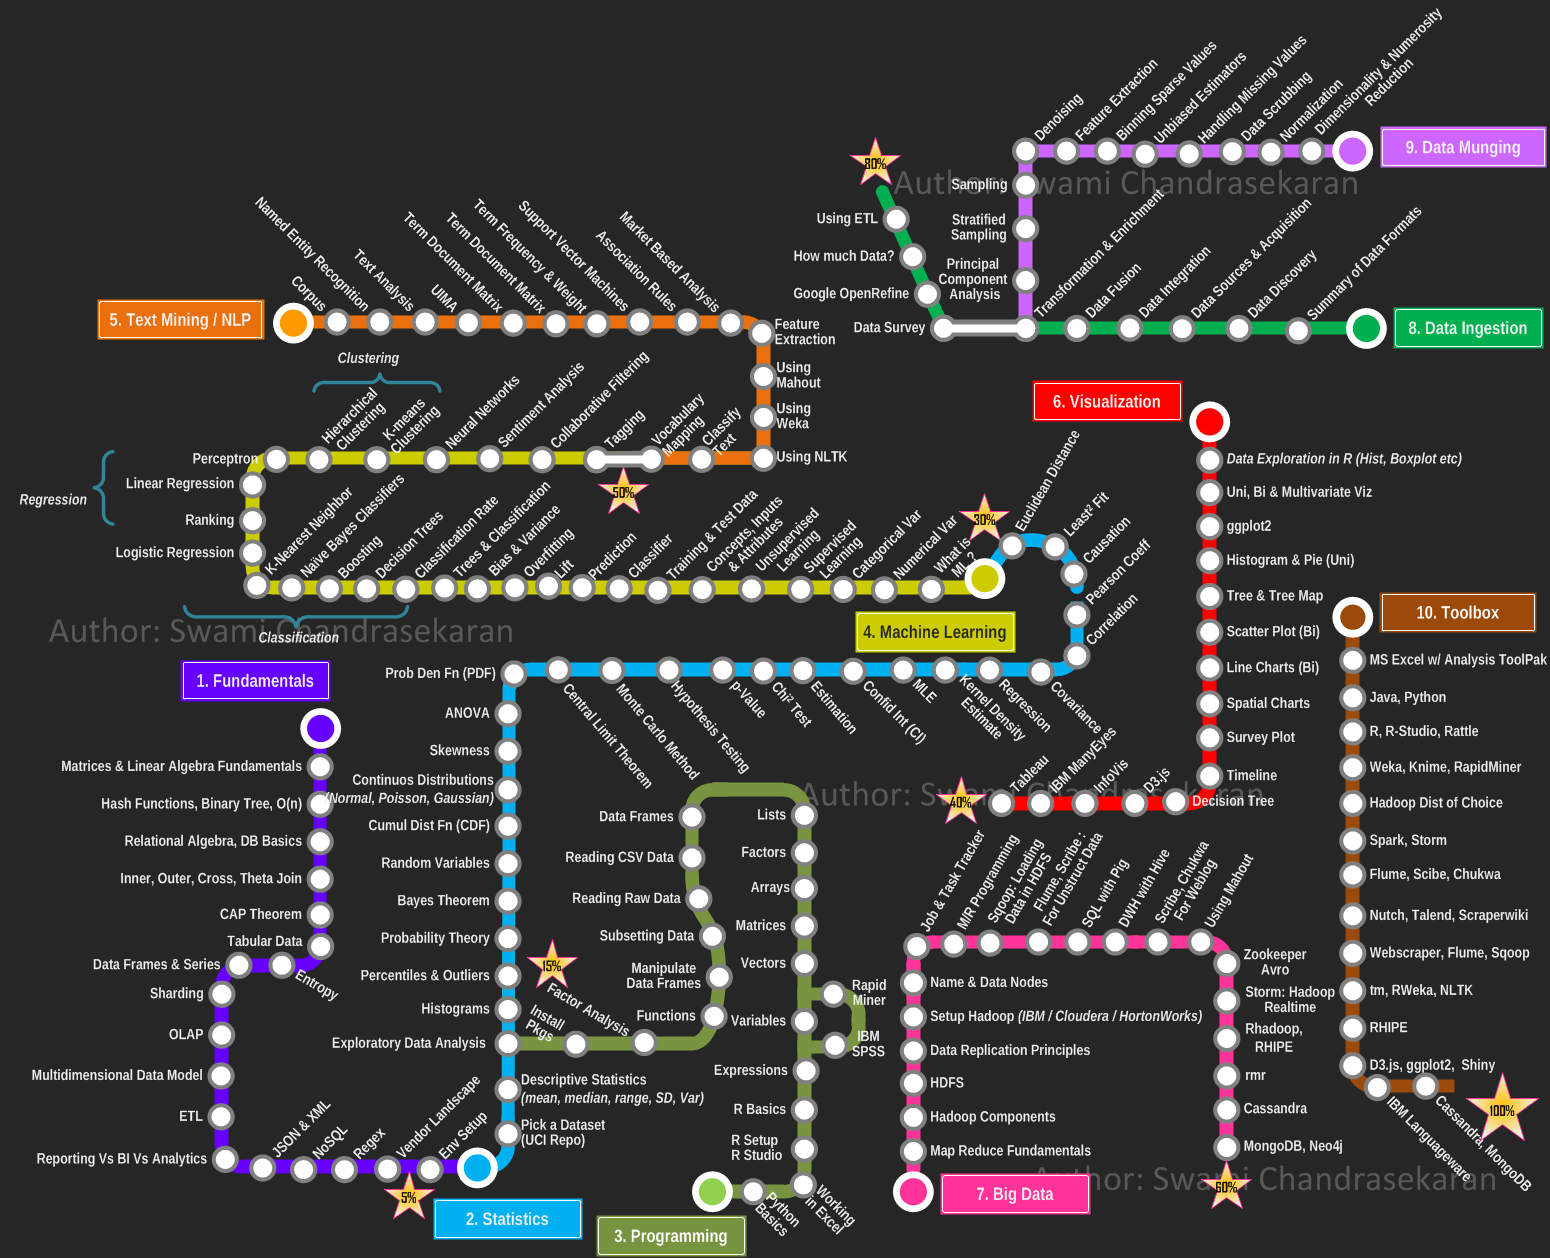
Becoming a Data Scientist – Curriculum via Metromap

by Swami Chandrasekaran

Data Science, Machine Learning, Big Data Analytics, Cognitive Computing .... well all of us have been avalanched with articles, skills demand info graph's and point of views on these topics (yawn!). One thing is for sure; you cannot become a data scientist overnight. Its a journey, for sure a challenging one. But how do you go about becoming one? Where to start? When do you start seeing light at the end of the tunnel? What is the learning roadmap? What tools and techniques do I need to know? How will you know when you have achieved your goal?
Given how critical visualization is for data science, ironically I was not able to find (except for a few), pragmatic and yet visual representation of what it takes to become a data scientist. So here is my modest attempt at creating a curriculum, a learning plan that one can use in this becoming a data scientist journey. I took inspiration from the metro maps and used it to depict the learning path. I organized the overall plan progressively into the following areas / domains,
  1. Fundamentals
  2. Statistics
  3. Programming
  4. Machine Learning
  5. Text Mining / Natural Language Processing
  6. Data Visualization
  7. Big Data
  8. Data Ingestion
  9. Data Munging
  10. Toolbox
Each area  / domain is represented as a "metro line", with the stations depicting the topics you must learn / master / understand in a progressive fashion. The idea is you pick a line, catch a train and go thru all the stations (topics) till you reach the final destination (or) switch to the next line. I have progressively marked each station (line) 1 thru 10 to indicate the order in which you travel. You can use this as an individual learning plan to identify the areas you most want to develop and the acquire skills. By no means this is the end; but a solid start. Feel free to leave your comments and constructive feedback.
PS: I did not want to impose the use of any commercial tools in this plan. I have based this plan on tools/libraries available as open source for the most part. If you have access to a commercial software such as IBM SPSS or SAS Enterprise Miner, by all means go for it. The plan still holds good.
PS: I originally wanted to create an interactive visualization using D3.js or InfoVis. But wanted to get this out quickly. Maybe I will do an interactive map in the next iteration.


Wednesday, May 29, 2013

TICKETS


GOBI2013 will be held in Oslo Spektrum June 10th 2013. When registering you get full access to the sessions, restaurants, cafes, expo and entertainment for the whole conference.
The web shop for conference tickets will ease the job of managing your tickets. Through the web shop you can buy any number of tickets and assign them to co-workers and/or friends who shall attend the conference. Each individual attendee is responsible for updating his or her contact information. When required information has been registered, the ticket will be sent directly to the attendee. Tickets are sent as a PDF containing a QR code on e-mail. Attendees must bring the QR code for registration at the conference site on June 10th. A conference pass will be created and handed out at registration.
Price: 5.900 NOK (EarlyBird, until 15.04.2013)
Price: 6.900 NOK (LateBird after 15.04.2013)
Tickets for GOBI2013 are administrated by Macsimum Event AS
Post Conference Seminar with Cindi Howson and Wayne Eckerson
Want to get the most out of the gurus while they’re in Oslo? Would you like to have a deep-dive seminar with BOTH keynote speakers? Attend the GOBI post-conference seminar on June 11th.
Price: 3.900 NOK (Without valid GOBI pass)
Price: 2.900 NOK (With valid GOBI pass from June 10th)

Questions about tickets? Contact: webshop.gobi@eventsystems.no

Tuesday, May 28, 2013

Post-conference seminar with Wayne Eckerson and Cindi Howson

W&C

Want to get the most out of the gurus while they’re in Oslo? Would you like to have a deep-dive seminar with BOTH keynote speakers? Attend the GOBI post-conference seminar on June 11th.
Secrets of Analytical Leaders: Insights from Information Insiders Wayne Eckerson, Principal, BI Leader Consulting
How do you bridge the worlds of business and technology? How do you harness data for business gain? How do you deliver value from BI and analytical initiatives? Based on Wayne’s book, “Secrets of Analytical Leaders: Insights from Information Insiders,” this session will unveil the secrets to success of top BI and analytical leaders from companies such as Zynga, Netflix, US Xpress, Nokia, Capital One, Kelley Blue Book and Blue KC, among others. The session will cover both the “soft stuff” of people, processes, and projects and the “hard stuff” of architecture, tools, and data required to create and sustain a successful BI and analytics program.
You Will Learn:
• How to organize a BI and analytics team for optimal performance
• How to deliver value quickly and earn credibility among business sponsors
• How to translate insights into business impact
• How to create and deploy analytical models
• How to create an agile data warehouse

BI Market Update and How to Choose a Visual Data Discovery Tool Cindi Howson, founder of BI Scorecard
As the face for the data warehouse, the BI tool is the most visible component to business users. BI tools continue to evolve to be more appealing, to reach new classes of users, and to speed the time to insight. At this session, BI tools expert Cindi Howson will offer strategies for managing your BI tool portfolio. She will highlight recent trends, the state of the market, differences in core modules, with a focus for selecting and deploying the right tool for the right user. The second half of the seminar provides an evaluation framework for evaluating dashboards and visual data discovery tools.
You Will Learn:
• State of the BI tools market and key trends
• State of BI standardization, motivations and challenges
• User segments, use cases, and tool positioning
• Differences in core modules
• Dashboard and visual data discovery use cases
• Strengths and weaknesses of leading products

The post-conference seminar is open for both GOBI-participants and others. Attend both GOBI main event and post-conference seminar and get discounts.
The post-conference seminar will take place at Dronning Eufemias gate 16, Bjørvika (Visma-bygget), on June 11th.
Agenda:
0800-0830: Registration
0830-1200: Wayne Eckerson: Secrets of Analytical Leaders: Insights from Information Insiders
1200-1230: Lunch
1300-1630: Cindi Howson: BI Market Update and How to Choose a Visual Data Discovery Tool

TICKETS AVAILABLE SOON!
Check out GOBI website www.gurusofbi.no for tickets.

Monday, October 8, 2012

Thursday, August 23, 2012

A BI Architectures Approach to Modeling and Evolving with Analytic Databases


Major shifts converging in today's BI environment bring the opportunity to discover new answers to old questions about what BI architectures are about and how they are designed.


August 21, 2012

By John O'Brien, Principal, Radiant Advisors


Whether you have been a BI architect managing a production data warehouse for many years or are embarking on building a new data warehouse, the new analytic technologies coming out today have never been so powerful and complex to understand. In fact, with so many analytic technologies available on the market, they are somewhat overwhelming as we struggle to make sense of what to do with them and which ones to use with our existing environments.


This is good for BI architects because it brings us back to BI architecture fundamentals, key data management principles, pattern recognition, and agile processes, along with BI capabilities that challenge classic BI architecture best practices to design what clearly makes sense to meet the demands of business today.


There are major shifts converging in today's BI environment, and these changes bring with them the opportunity to discover new answers to old questions about what a BI architecture is all about and how an architecture is designed. As I explore these questions in this article, I will focus on three main themes: BI architectures are strategic platforms that evolve to their full potential; good architectures are based on recognizing data management principles (patterns and so-called best practices are discovered later); and BI architecture design is purposeful at every stage of development and technology decisions follow this purpose.


Architecture Maturity and Information Capabilities


We have all seen the research that says BI architectures evolve into robust information platforms and value over time. BI teams have focused on increasing value through maturing their data warehouses from operational reporting to data marts to data warehouses and finally to enterprise data warehouses. This evolutionary approach is typical when balancing pressing tactical needs for information delivery with strategic development, and is found in many companies where business demands for information drive towards a data warehouse platform.


The classic data warehouse is the last thing to be built, if ever, because the emphasis remains on quicker delivery first and information consistency later. Unfortunately, this leads to data warehouses that reflect current information needs and doesn't foster the evolution of a mature analytics culture.


Instead, an architecture based on BI capabilities focuses on nurturing the analytic culture of the business community by first educating user communities about the BI capabilities available and then on business subject data that is delivered via BI capabilities. This approach centers the data warehouse architecture on BI capabilities such as information delivery; reporting and parameterized reporting; dimensional analytics for goals achievement; and advanced analytics for gaining insights, to name a few. These discussions recognize that the same consistent data has many usage patterns, behaviors, and roles in the decision process. A BI architecture that is designed in this way ensures that data models and chosen analytic technologies are best suited to their intended purpose.


However, this BI-capabilities approach is contrary to some BI architects' belief that there should be an all-in-one data warehouse platform in the enterprise.


Tuesday, July 24, 2012

The Future of Decision Making: Less Intuition, More Evidence


A fantastic post by Andrew McAfee

Human intuition can be astonishingly good, especially after it's improved by experience. Savvy poker players are so good at reading their opponents' cards and bluffs that they seem to have x-ray vision. Firefighters can, under extreme duress, anticipate how flames will spread through a building. And nurses in neonatal ICUs can tell if a baby has a dangerous infection even before blood test results come back from the lab.

The lexicon to describe this phenomenon is mostly mystical in nature. Poker players have a sixth sense; firefighters feel the blaze's intentions; Nurses just know what seems like an infection. They can't even tell us what data and cues they use to make their excellent judgments; their intuition springs from a deep place that can't be easily examined. . Examples like these give many people the impression that human intuition is generally reliable, and that we should rely more on the decisions and predictions that come to us in the blink of an eye.

This is deeply misguided advice. We should rely less, not more, on intuition.

A huge body of research has clarified much about how intuition works, and how it doesn't. Here's some of what we've learned:

•It takes a long time to build good intuition. Chess players, for example, need 10 years of dedicated study and competition to assemble a sufficient mental repertoire of board patterns.

•Intuition only works well in specific environments, ones that provide a person with good cues and rapid feedback . Cues are accurate indications about what's going to happen next. They exist in poker and firefighting, but not in, say, stock markets. Despite what chartists think, it's impossible to build good intuition about future market moves because no publicly available information provides good cues about later stock movements. Feedback from the environment is information about what worked and what didn't. It exists in neonatal ICUs because babies stay there for a while. It's hard, though, to build medical intuition about conditions that change after the patient has left the care environment, since there's no feedback loop.

•We apply intuition inconsistently. Even experts are inconsistent. One study determined what criteria clinical psychologists used to diagnose their patients, and then created simple models based on these criteria. Then, the researchers presented the doctors with new patients to diagnose and also diagnosed those new patients with their models. The models did a better job diagnosing the new cases than did the humans whose knowledge was used to build them. The best explanation for this is that people applied what they knew inconsistently — their intuition varied. Models, though, don't have intuition.

•It's easy to make bad judgments quickly. We have a many biases that lead us astray when making assessments. Here's just one example. If I ask a group of people "Is the average price of German cars more or less than $100,000?" and then ask them to estimate the average price of German cars, they'll "anchor" around BMWs and other high-end makes when estimating. If I ask a parallel group the same two questions but say "more or less than $30,000" instead, they'll anchor around VWs and give a much lower estimate. How much lower? About $35,000 on average, or half the difference in the two anchor prices. How information is presented affects what we think.

•We can't know tell where our ideas come from. There's no way for even an experienced person to know if a spontaneous idea is the result of legitimate expert intuition or of a pernicious bias. In other words, we have lousy intuition about our intuition.

My conclusion from all of this research and much more I've looked at is that intuition is similar to what I think of Tom Cruise's acting ability: real, but vastly overrated and deployed far too often.

So can we do better? Do we have an alternative to relying on human intuition, especially in complicated situations where there are a lot of factors at play? Sure. We have a large toolkit of statistical techniques designed to find patterns in masses of data (even big masses of messy data), and to deliver best guesses about cause-and-effect relationships. No responsible statistician would say that these techniques are perfect or guaranteed to work, but they're pretty good.

The arsenal of statistical techniques can be applied to almost any setting, including wine evaluation. Princeton economist Orley Ashenfleter predicts Bordeaux wine quality (and hence eventual price) using a model he developed that takes into account winter and harvest rainfall and growing season temperature. Massively influential wine critic Robert Parker has called Ashenfleter an "absolute total sham" and his approach "so absurd as to be laughable." But as Ian Ayres recounts in his great book Supercrunchers, Ashenfelter was right and Parker wrong about the '86 vintage, and the way-out-on-a-limb predictions Ashenfelter made about the sublime quality of the '89 and '90 wines turned out to be spot on.

Those of us who aren't wine snobs or speculators probably don't care too much about the prices of first-growth Bordeaux, but most of us would benefit from accurate predictions about such things as academic performance in college; diagnoses of throat infections and gastrointestinal disorders; occupational choice; and whether or not someone is going to stay in a job, become a juvenile delinquent, or commit suicide.

I chose those seemingly random topics because they're ones where statistically-based algorithms have demonstrated at least a 17 percent advantage over the judgments of human experts.

But aren't there at least as many areas where the humans beat the algorithms? Apparently not. A 2000 paper surveyed 136 studies in which human judgment was compared to algorithmic prediction. Sixty-five of the studies found no real difference between the two, and 63 found that the equation performed significantly better than the person. Only eight of the studies found that people were significantly better predictors of the task at hand. If you're keeping score, that's just under a 6% win rate for the people and their intuition, and a 46% rate of clear losses.

So why do we continue to place so much stock in intuition and expert judgment? I ask this question in all seriousness. Overall, we get inferior decisions and outcomes in crucial situations when we rely on human judgment and intuition instead of on hard, cold, boring data and math. This may be an uncomfortable conclusion, especially for today's intuitive experts, but so what? I can't think of a good reason for putting their interests over the interests of patients, customers, shareholders, and others affected by their judgments.

So do we just dispense with the human experts altogether, or take away all their discretion and tell them to do whatever the computer says? In a few situations, this is exactly what's been done. For most of us, our credit scores are an excellent predictor of whether we'll pay back a loan, and banks have long relied on them to make automated yes/no decisions about offering credit. (The sub-prime mortgage meltdown stemmed in part from the fact that lenders started ignoring or downplaying credit scores in their desire to keep the money flowing. This wasn't intuition as much as rank greed, but it shows another important aspect of relying on algorithms: They're not greedy, either).

In most cases, though, it's not feasible or smart to take people out of the decision-making loop entirely. When this is the case, a wise move is to follow the trail being blazed by practitioners of evidence-based medicine , and to place human decision makers in the middle of a computer-mediated process that presents an initial answer or decision generated from the best available data and knowledge. In many cases, this answer will be computer generated and statistically based. It gives the expert involved the opportunity to override the default decision. It monitors how often overrides occur, and why. it feeds back data on override frequency to both the experts and their bosses. It monitors outcomes/results of the decision (if possible) so that both algorithms and intuition can be improved.

Over time, we'll get more data, more powerful computers, and better predictive algorithms. We'll also do better at helping group-level (as opposed to individual) decision making, since many organizations require consensus for important decisions. This means that the 'market share' of computer automated or mediated decisions should go up, and intuition's market share should go down. We can feel sorry for the human experts whose roles will be diminished as this happens. I'm more inclined, however, to feel sorry for the people on the receiving end of today's intuitive decisions and judgments.

What do you think? Am I being too hard on intuitive decision making, or not hard enough? Can experts and algorithms learn to get along? Have you seen cases where they're doing so? Leave a comment, please, and let us know.


Thursday, June 21, 2012

Bankers call for advanced analytics

Technology officials in banking industry are deeply interested in the future of business intelligence, specifically predictive analytics processes that can analyze customer behavior. A recent Computing report found that financial officials are able to draw deeper analysis than retailers. Both bankers and store owners are interested in creating conditions that could leave customers feeling free to spend, with banks eager to drive customer dollars to their own line of payment cards.


Targeted offers

As Computing pointed out, banks have access to an important and unique data source for analytics - transaction data from customers' credit cards. Each use of a credit card contains a wealth of information - where it was used, what type of merchant made the sale. Companies can combine these data points to create a picture of customer interests and allow them to create an environment the encourages further spending and incentives that cardholders will want.
"The data is broader than a retailer would get, so it can go very deep and build meaningful profiles of customers. They can then ask, 'Six months ago, this individual was shopping at John Lewis and now they're shopping in Primark. What does that tell me?'" analytics officer Andrew Jennings told the source. "Banks are not very good at this, but the competitive environment is driving them towards [being good at it]. That's what we're seeing today."
According to Computing, Jennings also stated that while banks have depth of data that cannot be matched by individual merchants, the stores are more experienced actually creating analytics models. He mentioned that there is room for alliances between stores and card providers. Banks can agree to give retailers payments for each transaction placed on that institution's payment cards. Financial institutions can also create programs that give rewards directly to customers if they spend at certain allied merchants.


Unique skillsets

TechTarget recently examined efforts by companies to take predictive information from their data. The source consulted with strategic analytics expert Jennifer Golec, who described the ideal analyst's role as threefold - programmer, data scientist and storyteller. They must have programming know-how to deal with the complex and large data sets needed to make a predictive model. The data science will come in handy when developing processes that employ multiple variables. The storytelling flair will help analytics teams explain their findings in clear, business-focused terms to the rest of the company.

P.S.

Soon is comming post about a Business Intelligence solution focusing bank customers and their behaviour. I applied at the DnBNOR innovation price, but was ignored in 2009, maybe because BI analytics was not that actual then. STAY TUNED!


Tuesday, May 8, 2012

Microsoft Predictive Analytics


Predictive analytics is the next step in BI: not only can you be retrospective and see what has happened in your company in the past, but now we can distill new information from the old information to actually predict what will happen in the future. Jamie MacLennan, CTO of Predixion Software, explains the difference between business intelligence and predictive analytics and shares a program that Predixion has created in Excel to review the Practice Fusion data.


Featuring Bruno Aziza

Friday, March 30, 2012

Rafal Lukawiecki in SQL Server 2012 official launch in Oslo


First, thanks for invitation from Microsoft, specially Thale Mjavatn and nice organization of such an important event. The details for the event you find in this blog:
http://biblogg.no/2012/03/15/lansering-av-microsoft-sql2012/
and the agenda of the conference is here: http://www.microsoft.com/norge/bi-sql-fagdag/index.html
Rafal was fantastic as always and did a remarkable job explaining to the audience the new technologies behind MS SQL 2012, special focus on the Business Intelligence enhancement tools included. We got introduced to 2 new technologies: PowerView and BISM and little changes on what PowerPivot is now. Also, he spoke about trends where BI and Big Data will be the most important things in the future.
Once more thank you for the opportunity and thanks to all who were part of it.

Friday, March 9, 2012

BIandIT.com, a website that is going to have all important things in BI

My web site is Under Construction and is going to have the hotest topics and trends in Business Intelligence. You can find elegant solutions in Business Intelligence, special calculated members, Time Intelligence, Customer Intelligence, Competition Intelligence, Market Intelligence, Spatial Intelligence and Predictive Analytics. The site will have also Office Templates for Business Start-ups, for Market Analysis, ROI, First Year Costs etc... www.biandit.com is comming SOON :)

How I do Predictive Analytics without Data Mining?

This hot topic is comming soon. I will just describe a bit what will this topic will include. This topic is going to show how to do Predictive Analytics on your data without using Data Mining or DMX and just using MDX. How can Data Mining prediction Algorithms be "translated" from DMX to MDX. How accurate are they and what is the benefit of using MDX?

Wednesday, June 22, 2011

Predictive Analytics vs Data Mining

Technology Cycle:
Data warehousing is a mature technology, with approximately 70 percent of Forrester Research survey respondents indicating they have one in production. Data mining has endured significant consolidation of products since 2000, in spite of initial high-profile success stories, and has sought shelter in encapsulating its algorithms in the recommendation engines of marketing and campaign management software. Statistical inference has been transformed into predictive modelling. As we shall see, the emerging trend in predictive analytics has been enabled by the convergence of a variety of factors.

Technology Hierarchy:
In the technology hierarchy, data warehousing is generally considered an architecture for data management. Of course, when implemented, a data warehouse is a database providing information about (among many other things) what customers are buying or using which products or services and when and where are they doing so. Data mining is a process for knowledge discovery, primarily relying on generalizations of the "law of large numbers" and the principles of statistics applied to them. Predictive analytics emerges as an application that both builds on and delimits these two predecessor technologies, exploiting large volumes of data and forward-looking inference engines, by definition, providing predictions about diverse domains.

Methods:
The method of data warehousing is structured query language (SQL) and its various extensions. Data mining employs the "law of large numbers" and the principles of statistics and probability that address the issues around decision making in uncertainty. Predictive analytics carries forward the work of the two predecessor domains. Though not a silver bullet, better algorithms in operations research, risk minimization and parallel processing, when combined with hardware improvements and the lessons of usability testing, have resulted in successful new predictive applications emerging in the market. (Again, see Figure 1 on predictive analytics enabling technologies.) Widely diverging domains such as the behaviour of consumers, stocks and bonds, and fraud detection have been attacked with significant success by predictive analytics on a progressively incremental scale and scope. The work of the past decade in building the data warehouse and especially of its closely related techniques, particularly parallel processing, are key enabling factors. Statistical processing has been useful in data preparation, model construction and model validation. However, it is only with predictive analytics that the inference and knowledge are actually encoded into the model that, in turn, is encapsulated in a business application.

Definition
This results in the following definition of predictive analytics: Methods of directed and undirected knowledge discovery, relying on statistical algorithms, neural networks and optimization research to prescribe (recommend) and predict (future) actions based on discovering, verifying and applying patterns in data to predict the behavior of customers, products, services, market dynamics and other critical business transactions. In general, tools in predictive analytics employ methods to identify and relate independent and dependent variables - the independent variable being "responsible for" the dependent one and the way in which the variables "relate," providing a pattern and a model for the behavior of the downstream variables.

In data warehousing, the analyst asks a question of the data set with a predefined set of conditions and qualifications, and a known output structure. The traditional data cube addresses: What customers are buying or using which product or service and when and where are they doing so? Typically, the question is represented in a piece of SQL against a relational database. The business insight needed to craft the question to be answered by the data warehouse remains hidden in a black box - the analyst's head. Data mining gives us tools with which to engage in question formulation based primarily on the "law of large numbers" of classic statistics. Predictive analytics have introduced decision trees, neural networks and other pattern-matching algorithms constrained by data percolation. It is true that in doing so, technologies such as neural networks have themselves become a black box. However, neural networks and related technologies have enabled significant progress in automating, formulating and answering questions not previously envisioned. In science, such a practice is called "hypothesis formation," where the hypothesis is treated as a question to be defined, validated and refuted or confirmed by the data.

Friday, June 17, 2011

PowerPivot in Excel 2010

PowerPivot gives users the power to create compelling self-service BI solutions, facilitates sharing and collaboration on user-generated BI solutions in a Microsoft SharePoint Server 2010 environment, and enables IT organizations to increase operational efficiencies through Microsoft SQL Server 2008 R2-based management tools.

Tuesday, November 9, 2010

Information Managment Concepts

Following the behavioral science theory of management, mainly developed at Carnegie Mellon University and prominently represented by Barnard, Richard M. Cyert, March and Simon, most of what goes on in service organizations is actually decision making and information processes. The crucial factor in the information and decision process analysis is thus individuals’ limited ability to process information and to make decisions under these limitations.

According to March and Simon [1], organizations have to be considered as cooperative systems with a high level of information processing and a vast need for decision making at various levels. They also claimed that there are factors that would prevent individuals from acting strictly rational, in opposite to what has been proposed and advocated by classic theorists

Instead of using the model of the economic man, as advocated in classic theory, they proposed the administrative man as an alternative based on their argumentation about the cognitive limits of rationality.

While the theories developed at Carnegie Mellon clearly filled some theoretical gaps in the discipline, March and Simon [1] did not propose a certain organizational form that they considered especially feasible for coping with cognitive limitations and bounded rationality of decision-makers. Through their own argumentation against normative decision-making models, i.e., models that prescribe people how they ought to choose, they also abandoned the idea of an ideal organizational form.

In addition to the factors mentioned by March and Simon, there are two other considerable aspects, stemming from environmental and organizational dynamics. Firstly, it is not possible to access, collect and evaluate all environmental information being relevant for taking a certain decision at a reasonable price, i.e., time and effort [2]. In other words, following a national economic framework, the transaction cost associated with the information process is too high. Secondly, established organizational rules and procedures can prevent the taking of the most appropriate decision, i.e., that a sub-optimum solution is chosen in accordance to organizational rank structure or institutional rules, guidelines and procedures [3] [4], an issue that also has been brought forward as a major critique against the principles of bureaucratic organizations.[5]

According to the Carnegie Mellon School and its followers, information management, i.e., the organization's ability to process information, is at the core of organizational and managerial competencies. Consequently, strategies for organization design must be aiming at improved information processing capability. Jay Galbraith [6] has identified five main organization design strategies within two categories — increased information processing capacity and reduced need for information processing.

1.Reduction of information processing needs
1.Environmental management
2.Creation of slack resources
3.Creation of self-contained tasks
2.Increasing the organizational information processing capacity
1.Creation of lateral relations
2.Vertical information systems
Environmental management. Instead of adapting to changing environmental circumstances, the organization can seek to modify its environment. Vertical and horizontal collaboration, i.e. cooperation or integration with other organizations in the industry value system are typical means of reducing uncertainty. An example of reducing uncertainty in relation to the prior or demanding stage of the industry system is the concept of Supplier-Retailer collaboration or Efficient Customer Response.

Creation of slack resources. In order to reduce exceptions, performance levels can be reduced, thus decreasing the information load on the hierarchy. These additional slack resources, required to reduce information processing in the hierarchy, represent an additional cost to the organization. The choice of this method clearly depends on the alternative costs of other strategies.

Creation of self-contained tasks. Achieving a conceptual closure of tasks is another way of reducing information processing. In this case, the task-performing unit has all the resources required to perform the task. This approach is concerned with task (de-)composition and interaction between different organizational units, i.e. organizational and information interfaces.

Creation of lateral relations. In this case, lateral decision processes are established that cut across functional organizational units. The aim is to apply a system of decision subsidiarity, i.e. to move decision power to the process, instead of moving information from the process into the hierarchy for decision-making.

Investment in vertical information systems. Instead of processing information through the existing hierarchical channels, the organization can establish vertical information systems. In this case, the information flow for a specific task (or set of tasks) is routed in accordance to the applied business logic, rather than the hierarchical organization.

Following the lateral relations concept, it also becomes possible to employ an organizational form that is different from the simple hierarchical information. The Matrix organization is aiming at bringing together the functional and product departmental bases and achieving a balance in information processing and decision making between the vertical (hierarchical) and the horizontal (product or project) structure. The creation of a matrix organization can also be considered as management's response to a persistent or permanent demand for adaptation to environmental dynamics, instead of the response to episodic demands.

Source: Wikipedia

Saturday, June 13, 2009

Microsoft Surface in motion

This is a video that shows how Microsoft Surface can be used as hand-on device for Business Intelligence. This happened in Microsoft Conference in Seattle.

Tuesday, June 9, 2009

Microsoft Surface, new way to play arround

Microsoft Surface is a new technology based on touch screen and very useful for data presentation in Dynamic way. This new feature is very important for Business Intelligence as well, so the entire presentation in the last Conference was dedicated to BI and Data Mining.
Reference link:
http://www.youtube.com/watch?v=V94EVrp9nWk

Business Intelligence

This Blog will contain information about Business Intelligence, Data Mining, Data Modeling and Data Science including tutorials, white papers, important updates and business cases mostly based in Microsoft platform.
Our intention is open a discussion blog where experts can talk generally about Business Intelligence or can exchange views for particular problems that they experienced. We are going to talk about different BI platforms their advantages and disadvantages, against Microsoft Platform.
Analytics will be the main topic, SSAS will be the most discussed tool and SQL/MDX/DMX will be the most used scripts to explain many of the problems that BI Professionals face every day.
MDX and DMX will be part of this blog too. Advanced calculations that we can handle with MDX and problems for improving time in reporting large data warehouse calculations over dimensions.
Dimensional databases vs relational, OLAP Cubes, algorithms for time improvement will rich our Blog.
You will be updated with podcast, white papers, analysis and links that are important to our auditorium.

Best regards,
Besim Ismaili
Creator of the Blog